Chapter 5 Multiple-Choice Questions
Statistical Analysis of Data
Test yourself on these multiple-choice questions. Clicking on the letter of your choice will give you immediate feedback on whether you are correct. Even when you are incorrect, you will receive feedback that will help you learn the material better so that you do well on the exam.
-
Which of the following is NOT a descriptive statistic?
(a) t-test
(b) mean
(c) standard deviation
(d) range -
The purpose of descriptive statistics is to
(a) determine if the sample data accurately describe the population.
(b) simplify and organize large sets of data.
(c) help us decide whether population means are equal.
(d) all of the above -
Which of the following measures of central tendency can have more than one value in a single sample?
(a) mean
(b) median
(c) mode
(d) none of the above -
Which of the following measures of central tendency could be computed on a variable that is measured on a nominal scale of measurement?
(a) mean
(b) median
(c) mode
(d) all of the above -
Which of the following descriptive statistical procedures CANNOT be used with a continuous variable?
(a) a frequency distribution
(b) a grouped frequency distribution
(c) a median
(d) a mean -
If a frequency polygon showed a distinctive bunching of scores near the bottom of the scale with just a few scores in the middle and upper parts of a scale, we would say that the data were
(a) normally distributed.
(b) positively skewed.
(c) negatively skewed.
(d) symmetric. -
A normal curve is
(a) positively skewed.
(b) negatively skewed.
(c) symmetric.
(d) bimodal. -
Which measure of variability could remain unchanged if one score in the sample decreased by 10 points?
(a) range
(b) variance
(c) standard deviation
(d) All of these measure would always change if one score were changed. -
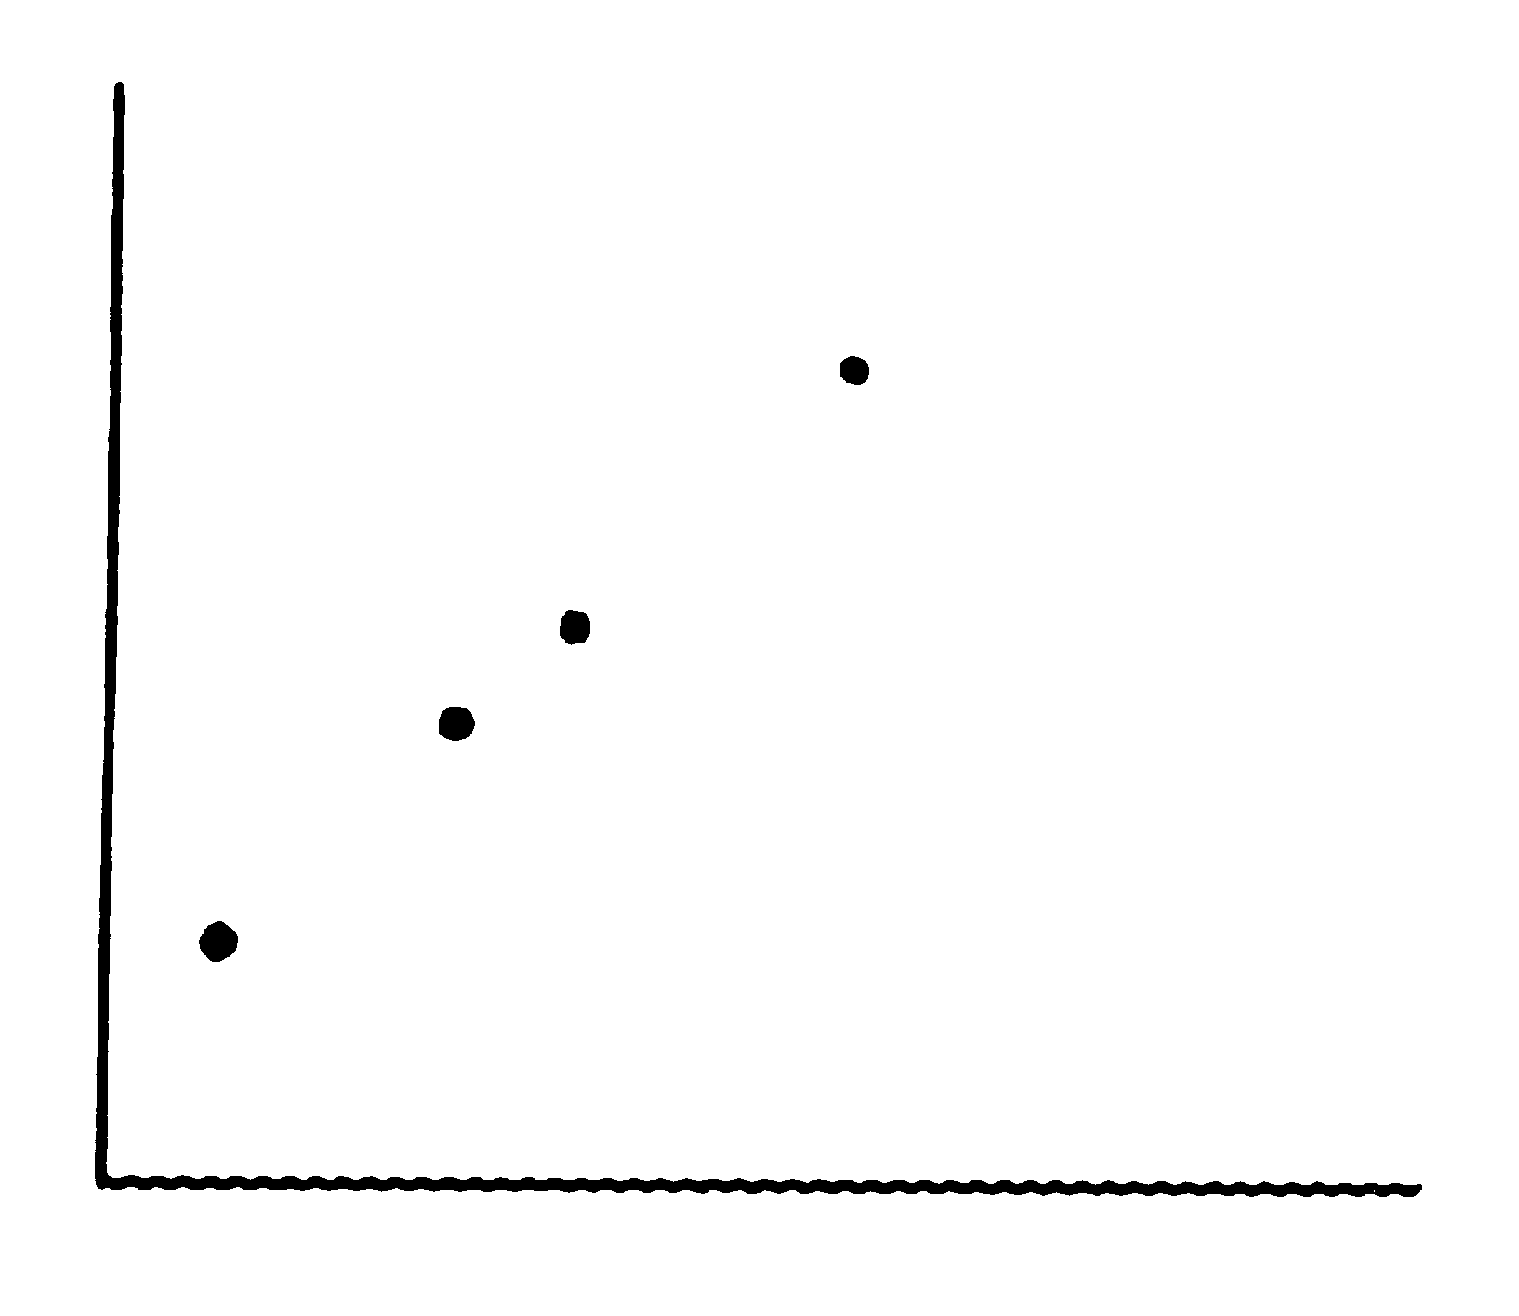
For the data illustrated in the scatter plot below, what is the product-moment correlation?

(a) 0.00
(b) +1.00
(c) -1.00
(d) You cannot tell from the scatter plot. -
If you wanted to quantify the degree of relationship between academic achievement and creativity, which correlation coefficient would you want to use?
(a) Pearson product-moment correlation
(b) Spearman rank-order correlation
(c) Either would be appropriate.
(d) It would depend on how the variables were measured. -
Which term refers to the sensitivity of a statistical procedure?
(a) statistical reliability
(b) validity or statistical validity
(c) statistical replication
(d) power or statistical power -
Which technique would be most sensitive to (i.e., would help you identify) a nonlinear relationship?
(a) the Pearson product-moment correlation
(b) the Spearman rank-order correlation
(c) a scatter plot
(d) a t-test -
Which correlation represents the strongest relationship?
(a) +.37
(b) +.68
(c) -.02
(d) -.73 -
If alpha is set to .05, what will the level of Type II error be?
(a) .05
(b) .95
(c) 0
(d) cannot say -
What will happen if the researcher increases the level of Type I error without making any other changes?
(a) The level of Type II error will increase.
(b) The level of Type II error will decrease.
(c) Alpha will decrease.
(d) There will be no change in either alpha or the level of Type II error. -
If two populations are different on their population means and the inferential statistical test leads you to conclude that the populations are equivalent, you have
(a) made a Type I error.
(b) made a Type II error.
(c) drawn a correct inference.
(d) inflated your alpha. -
The distinction between the average deviation and the variance is
(a) the average deviation is the square root of the variance.
(b) the average deviation is the average distance each score is from the mean whereas the variance in the average squared distance each score is from the mean.
(c) the average deviation is the square of the variance.
(d) the variance is the square of the standard deviation, which is equal to .707 times the average deviation.