 Graziano & Raulin
Research Methods (9th edition)
Biased Versus Unbiased Estimates
of Population Parameters
Earlier we talked about biased samples, which were samples that clearly did not represent the population of interest. Now we are going to talk about a different kind of bias.
You learned earlier that one can think of statistical procedures as a way of drawing conclusions about population parameters on the basis of sample statistics. You also learned in the section on notation that the distinction between population parameters and sample statistics is so important that we use different letters to refer to them. We use Greek letters to refer to population parameters and Roman letters to refer to sample statistics. Now we are going to pull all of those concepts together and make a very important point about the estimation of population parameters.
We define a statistic as an unbiased estimate of a population parameter if the statistic tends to give values that tend to be neither consistently high nor consistently low. They may not be exactly correct, because after all they are only an estimate, but they have no systematic source of bias. If you compute the sample mean using the formula below, you will get an unbiased estimate of the population mean, which uses the identical formula.
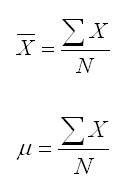
Saying that the sample mean is an unbiased estimate of the population mean simply means that there is no systematic distortion that will tend to make it either overestimate or underestimate the population parameter.
We run into a problem when we work with the variance, although it is a problem that is easily fixed. The formula for the population variance is shown below. If we use that same formula for computing the sample variance, we will get a perfectly fine index of variability, which is equal to the average squared deviation from the mean. That formula is also shown below.
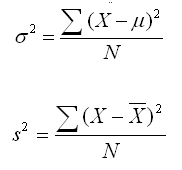
Unfortunately, the formula for the sample variance shown above is a biased estimate of the population variance. It tends to underestimate the population variance.
Fortunately, it is possible to determine how much bias there is and adjust the equation to correct for the bias. The equation below, in which you divide by N-1 instead of N, provides an unbiased estimate of the population variance. For that reason, it is the equation that statisticians use when computing the variance. After all, virtually all statistics are used to make judgments about the population on the basis of a sample. So it makes sense to use unbiased estimates of population parameters.
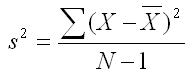
If N is small, the amount of bias in the biased estimate of variance equation can be large. For example, if N is 5, the degree of bias is 25%. But as N increases, the degree of bias decreases. For example, if N is 100, the amount of bias is only about 1%. But any bias is unacceptable, so we will always be using the unbiased estimate of variance that divides the sum of squared differences from the mean by N-1.
The mathematics of why dividing by N-1 provides an unbiased estimate of the population variance is beyond the level of this text. However, it has to do with the fact that we are forced to estimate the population mean in order to compute the sample variance. The sample mean may be an unbiased estimate of the population mean, but it will never be a perfect estimate of that mean. The slight error that is introduced by having to estimate the population mean is the source of the bias.
As you will learn when we discuss sampling distributions, the larger the sample, the more accurate our estimate of the population mean. That is why the correction for bias in the variance formula has little effect when the sample size is large, but a much larger effect when the sample size is small.
|
Use the Back Arrow Key on the Browser Program to Return |