 Graziano & Raulin
Research Methods (9th edition)
Computing Kappa
Kappa is a measure of interrater agreement that takes into account the base rates of the classification categories. Kappa is used when the raters are classifying participants into a limited set of categories. This is most often the case in the process of diagnosis. It is best illustrated with an example.
Suppose that two psychologists are diagnosing 100 people in a psychiatric hospital into three categories (schizophrenia, bipolar disorder, other). The categories need to be mutually exclusive and exhaustive. Mutually exclusive means that a person can fit into ONLY one category, and exhaustive means that EVERY person will fit into one of the categories. This situation might produce a 3 x 3 data matrix like the one shown below.
First Psychologist |
|||
Second Psychologist |
Schizophrenia |
Bipolar Disorder |
Other |
Schizophrenia |
29 | 6 | 5 |
Bipolar Disorder |
8 | 20 | 7 |
Other |
1 | 2 | 22 |
We will organize this table a bit by computing the row and column totals as shown below. The column totals are the number of people given a particular diagnosis by the first psychologists (38, 28, and 34 for schizophrenia, bipolar disorder, and other, respectively). The row totals represent the same thing for the second psychologist (40, 35, 25, respectively). The diagonal represents the agreements between these two psychologists. So both psychologist diagnosed 29 people with schizophrenia, 20 with bipolar disorder, and 22 that with some other disorder. If we sum that number, we get the total number of agreements (29+20+22=71). Therefore, we could say that there is a 71% agreement rate for these two psychologists. However, it is easier to get agreement when there are a small number of categories and when most people fall into one of the categories. Kappa takes this into account.
First Psychologist |
||||
Second Psychologist |
Schizophrenia |
Bipolar Disorder |
Other |
TOTALS |
Schizophrenia |
29 | 6 | 5 | 40 |
Bipolar Disorder |
8 | 20 | 7 | 35 |
Other |
1 | 2 | 22 | 25 |
TOTALS |
38 | 28 | 34 | 100 |
To compute Kappa, we need to make two other computations. First, we need to convert the numbers in the column and row totals of the table to proportions by dividing each number by the total number of subjects. In our example, the total is 100, so all we will do is move the decimal place. For example, 40 becomes .40 (40/100).
We then need to compute the expected proportions in each cell if we assume that there is no relationship between the two sets of diagnosis. This is the logic of the procedure for a test called the Chi Square test for independence, which is covered elsewhere on this website We compute those expected proportions by multiply the the row proportion by the column proportion. In the table below, those expected cell proportions are shown in parentheses.
It may not be obvious, but if you have done these computations correctly, the sum of the observed cell proportions will equal 1.00, and the same will be true for the sum of the expected cell proportions. In fact, the row and mean proportion totals will be the same whether you are summing the observed proportions or the expected proportions.
First Psychologist |
||||
Second Psychologist |
Schizophrenia |
Bipolar Disorder |
Other |
TOTALS |
Schizophrenia |
.29 (.152) | .06 (.112) | .05 (.136) | .40 |
Bipolar Disorder |
.08 (.133) | .20 (.098) | .07 (.119) | .35 |
Other |
.01 (.095) | .02 (.07) | .22 (.085) | .25 |
TOTALS |
.38 | .28 | .34 | 1.00 |
To compute Kappa, we will compute two sums: Po and Pe. Po is the sum of the observed proportions in the diagonal cells (i.e., the agreements). In this case, Po=.29+.20+.22=.71. Pe is the sum of the expected proportions in the same diagonal cells. In this case, Pe=.152+.098+.085=.335. We then plug these two numbers into the equation below.
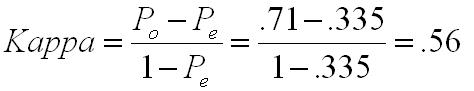
Kappa is interpreted like other reliability index. A Kappa of 1.00 means that there is perfect agreement, and a Kappa of 0.00 means there is no agreement.