Path Analysis
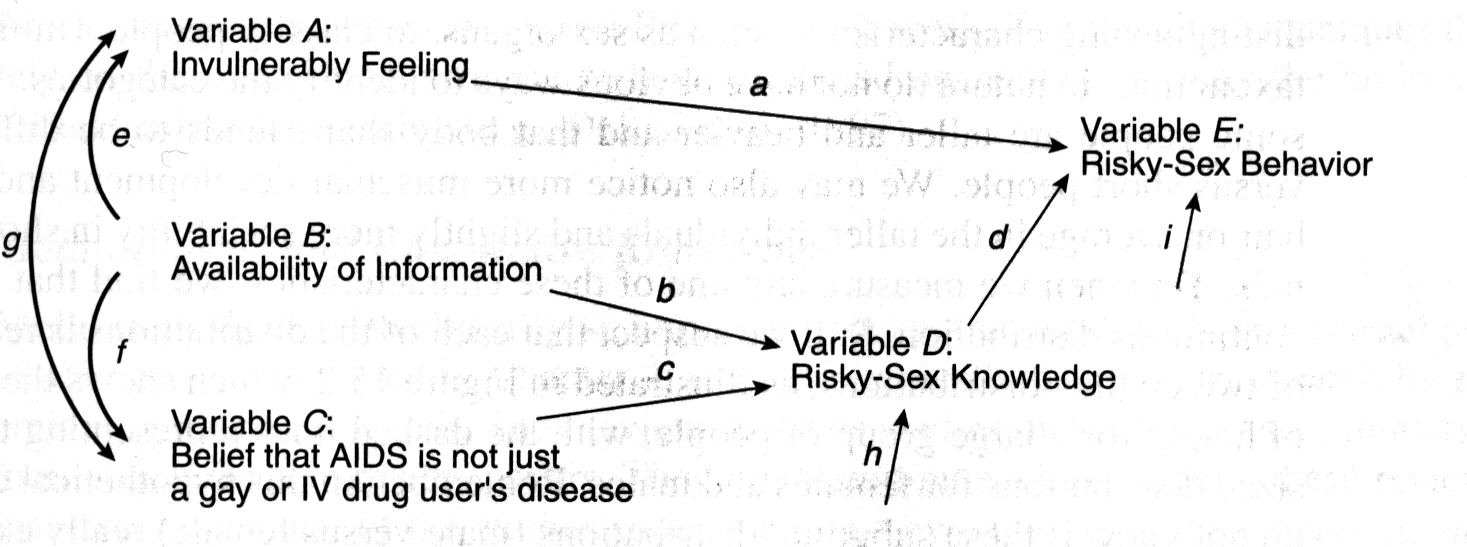
Path analysis is a relatively new procedure for interpreting correlational data. It is one of several regression procedures in a general class known as latent variable models. In a latent variable model, we make assumptions that the observed data are due to a specified set of latent (or unobserved) variables. In path analysis, we test the viability of a hypothesized causal model of the relationship between observed variables. For example, suppose that we have three variables (A, B, and C), which we hypothesize are causally related to another variable (E). For our hypothetical example, we will assume that variable E is risky-sex behavior, which is operationally defined as engaging in unprotected sex with a partner whose HIV status is unknown. Understanding why people engage in risky sex may provide insights into how to reduce such dangerous behavior. Suppose that we hypothesize that the three factors that affect risky-sex behavior are a feeling of invulnerability (variable A), the availability of information on AIDS transmission (variable B), and the strength of the belief that AIDS is a disease that only gay men and IV drug users get (variable C). Furthermore, we believe that variables B and C have their effect on risky-sex behavior by influencing the likelihood that someone will bother to learn about what is risky behavior when the information is available to them (variable D). This model is illustrated in figure below using the traditional notation of path analysis. The straight lines with arrows represent hypothesized causal connections. Curved lines with bi-directional arrows acknowledge possible correlations between the initial variables. Variables D and E also have short arrows, called residuals, that represent variation that is unexplained by our model. We could have made our model more complex by adding additional variables. For example, we might hypothesize that drinking might increase and knowing someone with AIDS might decrease the feeling of invulnerability. But for our example, we will focus on only the variables shown in the figure below. Each line or path in the model is represented by a lowercase letter, which represents the path coefficient. These path coefficients are calculated from the intercorrelation matrix of the variables in the model. The computational procedures are well beyond this text, but the interested student can consult Loehlin (1992). If the size of the hypothesized path coefficients is large and the residuals are generally small, the model is considered feasible. You may want to consult the research literature to see how path analysis is used and interpreted. A good example is Dermen, Cooper, and Agocha (1998), who describe an analysis of risky sex behavior and its relationship to alcohol use.

References
Dermen, K. H., Cooper, M. L., & Agocha, V. B. (1998). Sex-related alcohol expectancies as moderators of the relationship between alcohol use and risky sex in adolescents. Journal of Studies on Alcohol, 59, 71-77.
Loehlin, J. C. (1992). Latent variable models: An introduction to factor, path, and structural analyses (2nd ed.). Hillsdale, NJ: Lawrence Erlbaum.