 Graziano & Raulin
Research Methods (9th edition)
Taxometric Search Procedures
A taxon is a group that is different in kind from another group. For example, males are a taxon that is different from the taxon of females. In contrast, anxious people are probably different from less anxious people only in the fact that they are higher on the dimension of anxiety. It is often valuable to know whether there is a taxonic difference or a dimensional difference separating one group from another. It is easy to tell that some phenomena (e.g., sex) are taxonic. Other phenomena are obviously dimensional (e.g., intelligence), with people distributed continuously across a dimension. But what about phenomena like schizophrenia. Is schizophrenia a category distinctly different from a nonschizophrenic state or is it a dimension whose extreme scores qualify for a diagnosis? Knowing the answer to this question can help to focus our search for causes for schizophrenia. If schizophrenia is taxonic, it is more likely that a single primary gene is involved in the disorder.
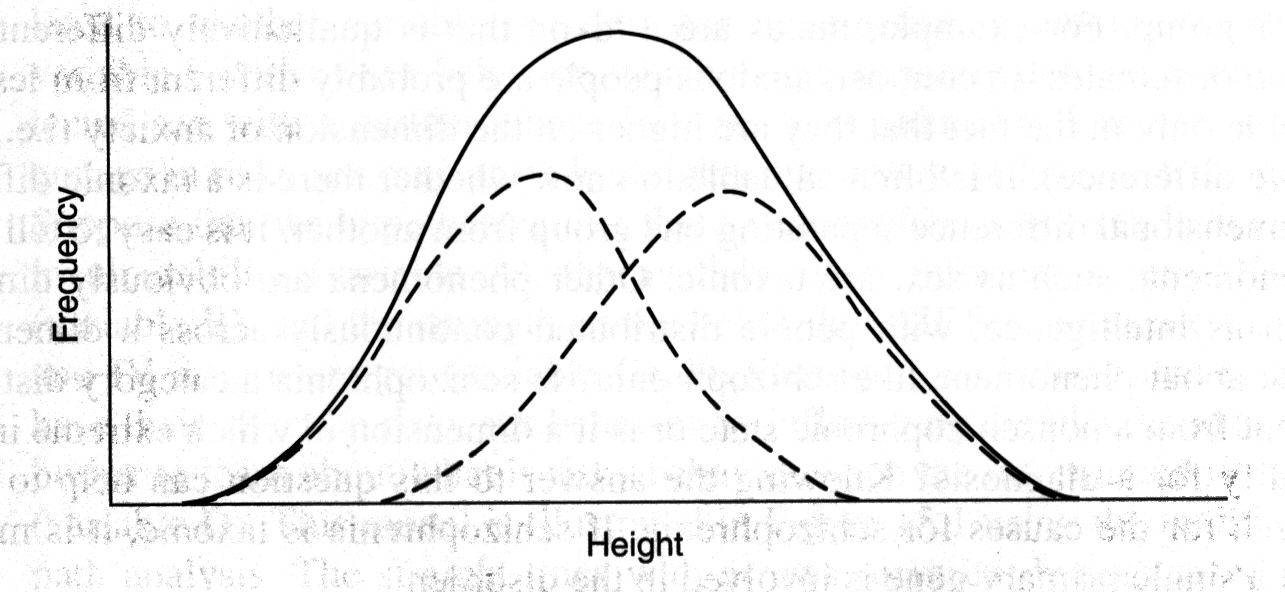
Taxometric search procedures are designed to address this question. These procedures are applied when we suspect there might be a taxonomy, but the only indicators that we have show a continuous distribution. This is best illustrated with an example that we already know represents a taxonomy. Suppose we look at people and suspect that there are really two types of people (males and females). Suppose that there were no obvious distinguishing characteristics such as sex organs to classify people. Unlike sex, most taxonomies in nature do not have such obvious ways to identify the taxonic categories. We note that some people are taller and heavier and that body shape tends to be different in tall versus short people. We may also notice more muscular development and more body hair on average in the taller individuals and generally greater sociability in shorter individuals. Yet when we measure any one of these characteristics, we find that they look like a continuous distribution. Still we suspect that each of the distributions is really the sum of two distributions. The figure below illustrates this hypothesis, showing the distribution of height for a large group of people, with the dashed lines representing the hypothesized distributions for females and males. Remember, in this hypothetical example, we do not know if these subgroup (male vs. female) distributions really exist. Even if they do exist, we have no way of telling who belongs in which group. If we classify everyone above a certain height as male and everyone below that height as female, you can see that no matter what height we choose, we will make many classification errors because the distributions overlap considerably.
Taxometric search procedures look for mathematical relationships between variables that should exist only if the data are taxonic. If those relationships are found, it suggests that there are two distinct categories. If they are not found, it suggests that there is a dimension on which participants are distributed. A variety of taxometric procedures have been developed. The details of these procedures are well beyond what we could cover in this text. The interested reader is referred to Meehl and Yonce (1994, 1996) or Waller & Meehl (1998) for specifics.
References
Meehl, P. E., & Yonce, L. J. (1994). Taxometric analysis: I. Detecting taxonicity with two quantitative indicators using means above and below a sliding cut (MAMBAC procedure). Psychological Reports, 74, 1059–1274.
Meehl, P. E., & Yonce, L. J. (1996). Taxometric analysis: II. Detecting taxonicity using covariance of two quantitative indicators in successive intervals of a third indicator (Maxcov procedure). Psychological Reports, 78, 1091–1227.
Waller, N. G., & Meehl, P. E. (1998). Multivariate taxometric procedures: Distinguishing types from continua. Thousand Oaks, CA: Sage.