Graziano & Raulin
Research Methods (9th edition)
Correlation and Regression
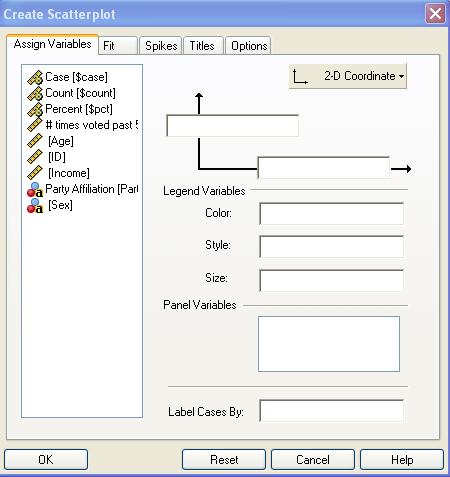
This screen shows the Create Scatterplot box. To open this box, select the Graph menu, Interactive submenu, and the Scatterplot option. To produce a scatter plot of income and age, move one variable to the X axis and the other variable to the Y axis of the graph shown. Then click on the OK button.