Graziano & Raulin
Research Methods (9th edition)
Descriptive Statistics
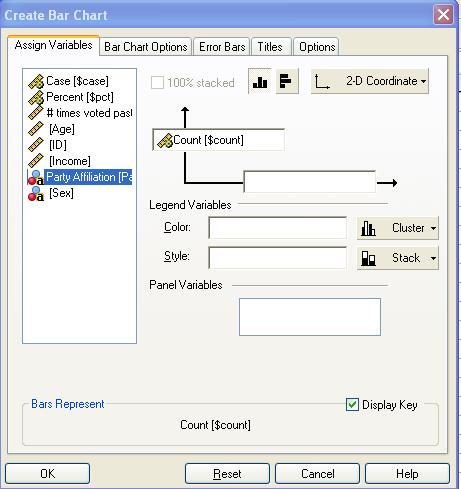
To graph the frequencies for a variable, you select the Graph menu, the Interactive submenu, and the Bar option. We then drag and drop our Party Affiliation variable the the X-axis in the graph shown and then click OK to create the graph.
Try some of the other options to see what possibilities are available. You really cannot screw things up, so play around with the program. If you do not like what you get, just delete it and try again.