 Graziano & Raulin
Research Methods (9th edition)
Independent Samples t-Test
The independent samples t-test, sometimes called the simple t-test, tests the null hypothesis that there is no difference between two independent samples. In other words, if the t-test is statistically significant, we would conclude the the populations from which the samples were drawn had different population means.The terminology that we would use is that the groups are significantly different from one another.
To compute the independent samples t-test, we start by setting up two columns, one for each group. In our example, we have labeled the columns Group 1 and Group 2, but we could also have labeled them X1 and X2, respectively.
Note that we do not label them as X and Y, as we did in computing correlations, because these are the same measures being taken in each group. Therefore, we would use the same letter to indicate this fact and use a subscript to indicate which group we are talking about. This notation is used in the formula for the t-test.
Weu put the scores in the two columns. Note that we do not necessarily have the same number of participants in each group, so the number of scores in the two columns may be different. Then, for each column, you compute the following values.
- The sum of the column.
- The sum of the squared values of the column (square each score and then sum it).
- The sample size for the column.
- The mean for the column (sum divided by the sample size).
- The sum of squares (SS) for the column. (The formula for the SSs is listed under the computational procedures for the variance.)
| Group 1 | Group 2 | |
| 5 | 3 | |
| 8 | 5 | |
| 7 | 2 | |
| 8 | 3 | |
| 7 | ||
| sum | 35 | 13 |
| sum sq | 251 | 47 |
| N | 5 | 4 |
| mean | 7.00 | 3.25 |
| SS | 6.00 | 4.75 |
Compute the value of t using the equation below. All of the notation should be familiar at this point (mean, SS, N). The only difference in the notation is that the means, SSs, and Ns are subscripted to show which group they represent.
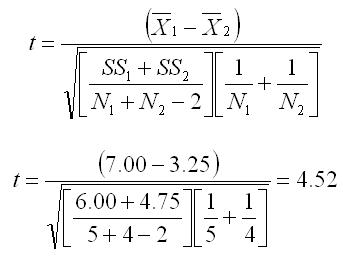
To evaluate the results, you compare the computed t to the critical value of t. The critical value of t (obtained from the Student's t Table) is 2.365 (alpha = 0.05 and df = N1 + N2 - 2 = 7). Because the computed value of t (4.52) exceeds the critical value (2.365), we reject the null hypothesis and conclude that the two populations from which the samples are drawn do have different means.